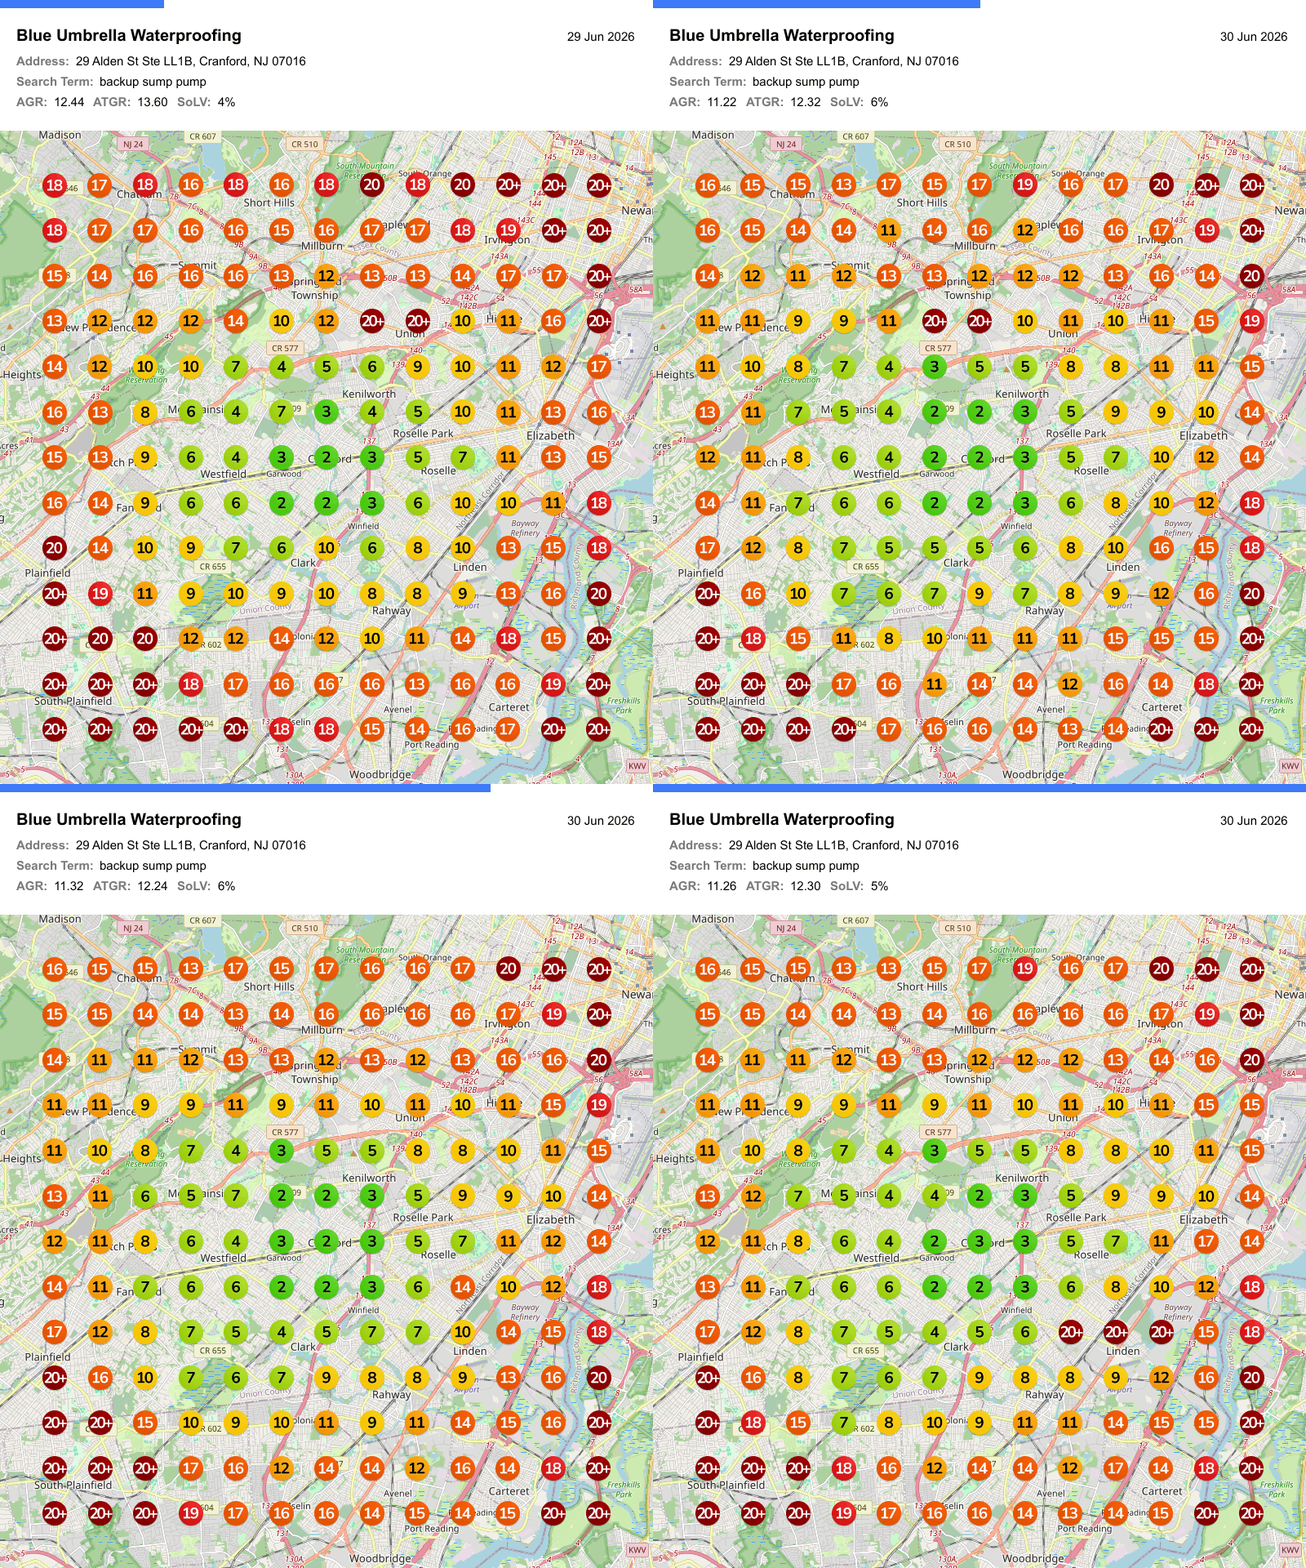
A single geogrid is a snapshot; Scheduled GeoGrids are the movie. Set up a schedule once and LocalOptics re-scans your search terms automatically, building the ranking history that shows whether your local SEO work is actually moving the map.
Setting up a schedule
Each scheduled config belongs to one location and carries:
Search terms - as many as you want to track; each can be toggled on or off individually.
Frequency - daily, weekly (pick the day), monthly (pick the date), or a one-time run.
Grid settings - the same size and point distance options as live geogrids.
Every run consumes credits like a live scan (one per grid point, per search term), so a 13x13 grid with five search terms costs 845 credits per cycle - size your grid and frequency to your budget.
Reading the results
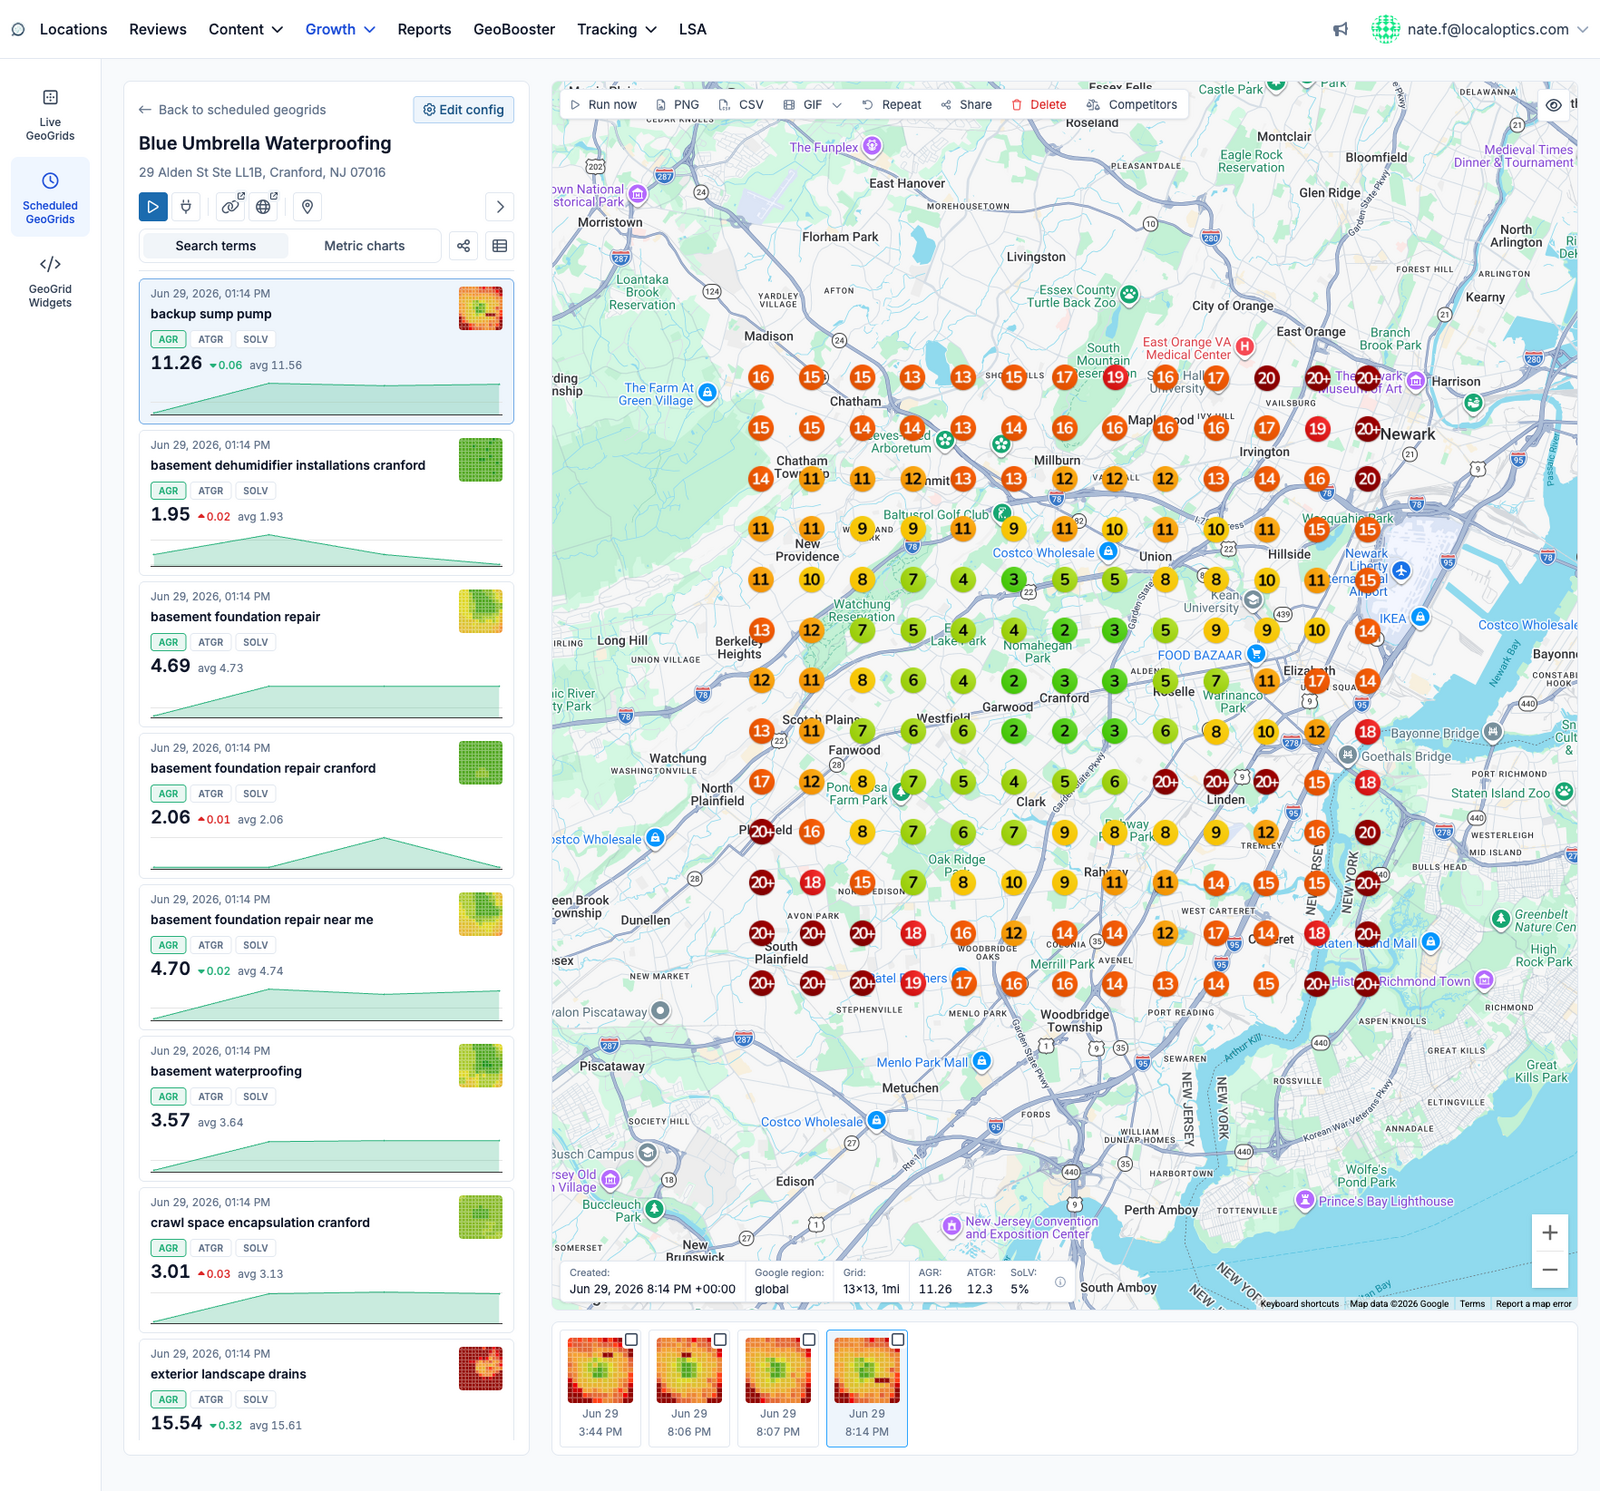
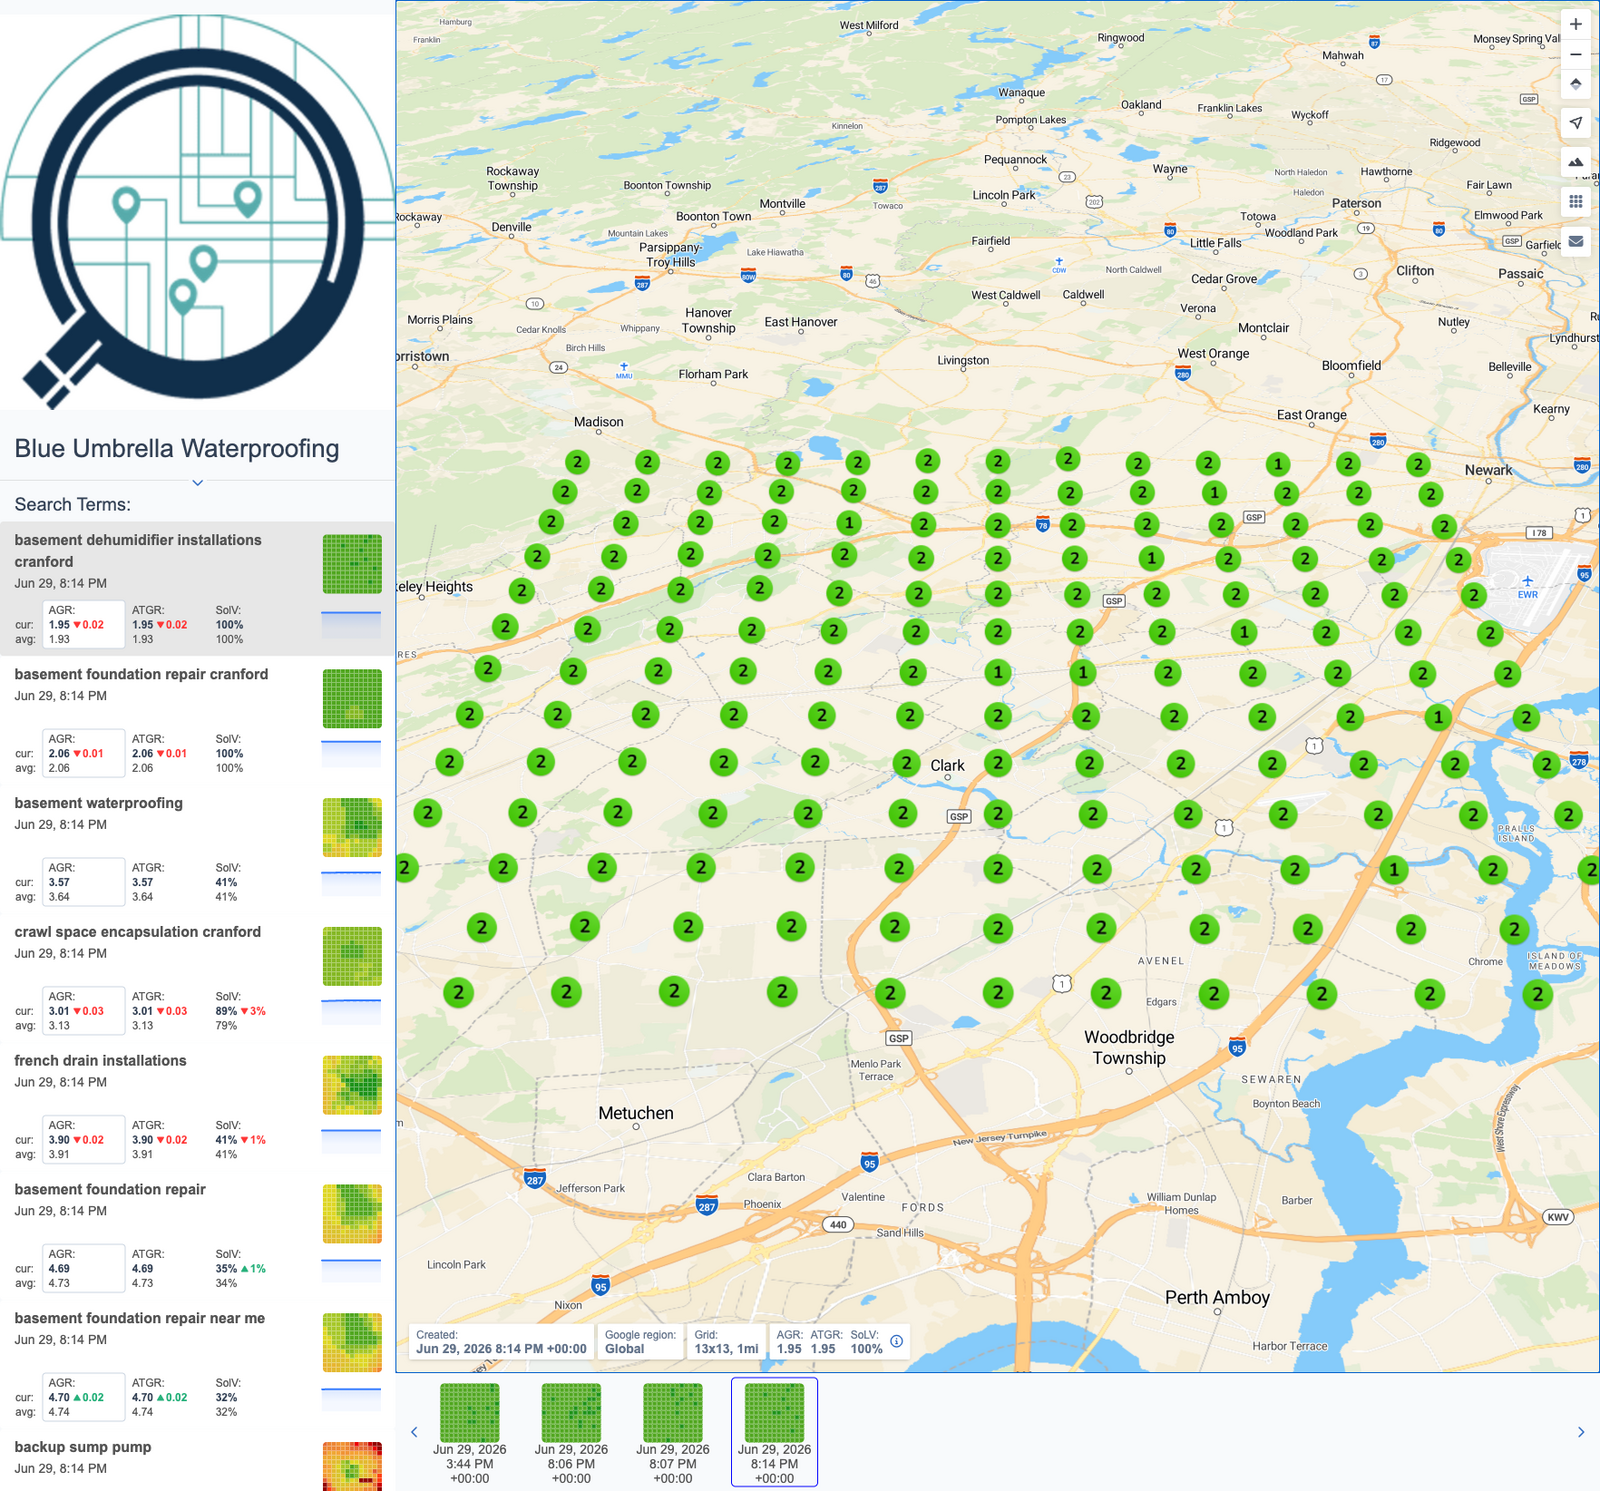
The left panel lists every search term with its latest ATGR, the change since the previous run (green down-arrows are improvements), and a sparkline of its history - switch to the Metric charts tab for full trend graphs of ATGR, AGR and SoLV per search term. The filmstrip along the bottom is the run history: click any past run to load its grid onto the map and compare periods visually.
LocalOptics also watches for wins automatically: when any grid point moves into the top 3 since the last run, it's flagged as a "new top 3" - and the config remembers the best rank ever achieved at every point.
Toolbar extras
Everything from live geogrids (PNG, CSV, Share, Competitors) plus:
Run now - trigger an off-schedule scan immediately.
GIF - export the run history as an animated map, the most persuasive before/after artifact you can send a client.
Edit config - change search terms, frequency or grid settings any time.
Public links - share a search term's ongoing results as a live public page, optionally limited to a date range.
Here it is for a real config - each search term with its trend at left, the run filmstrip below the map:
Comparing runs
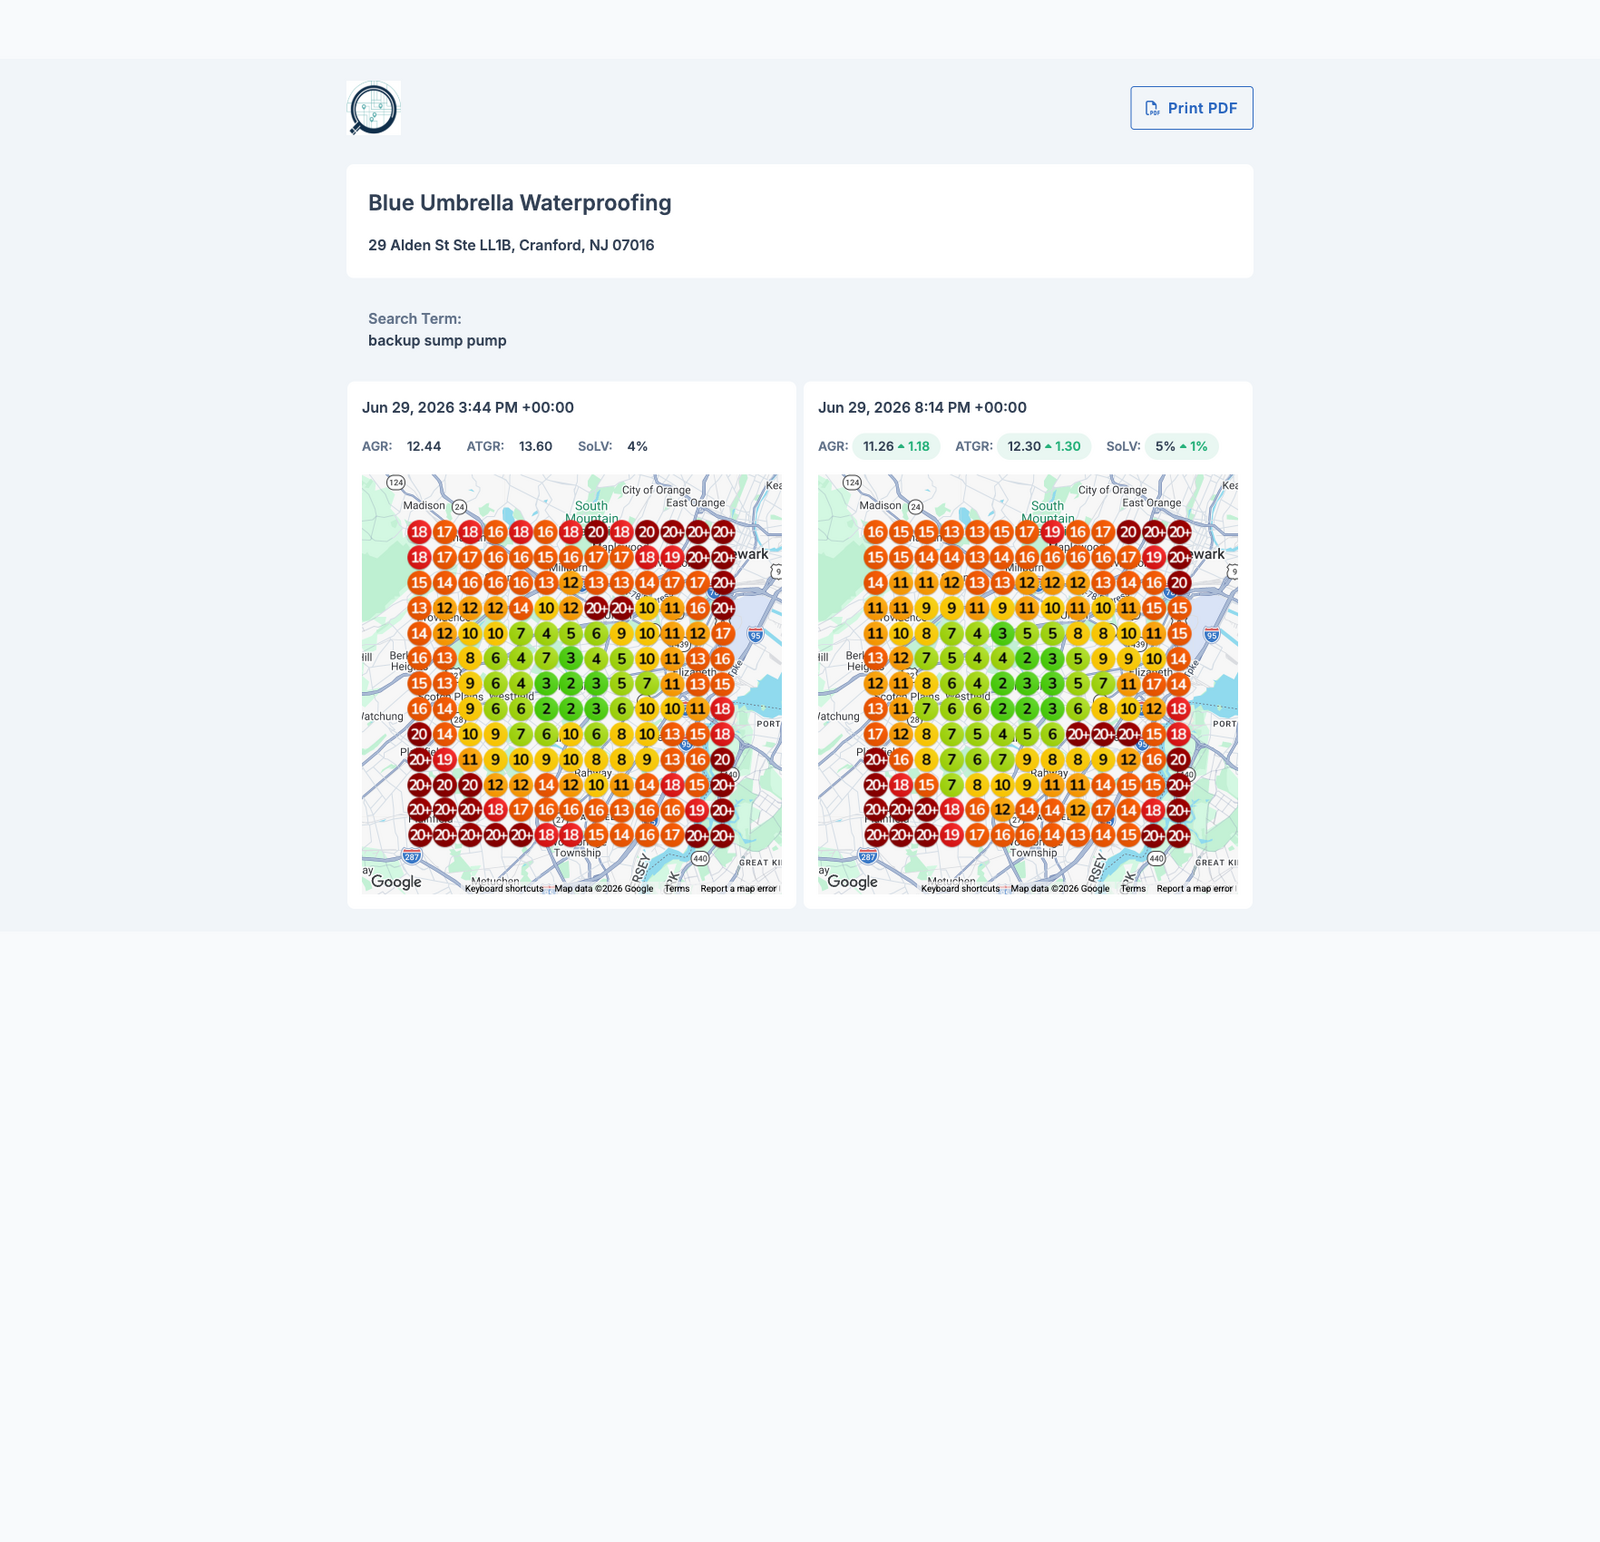
To see exactly what changed between two dates, tick the checkbox on any two runs in the filmstrip and click View comparison. The grids open side by side on a shareable page, each with its AGR, ATGR and SoLV - the newer one annotated with the change - plus a Print PDF button for client-ready output:
Sharing publicly
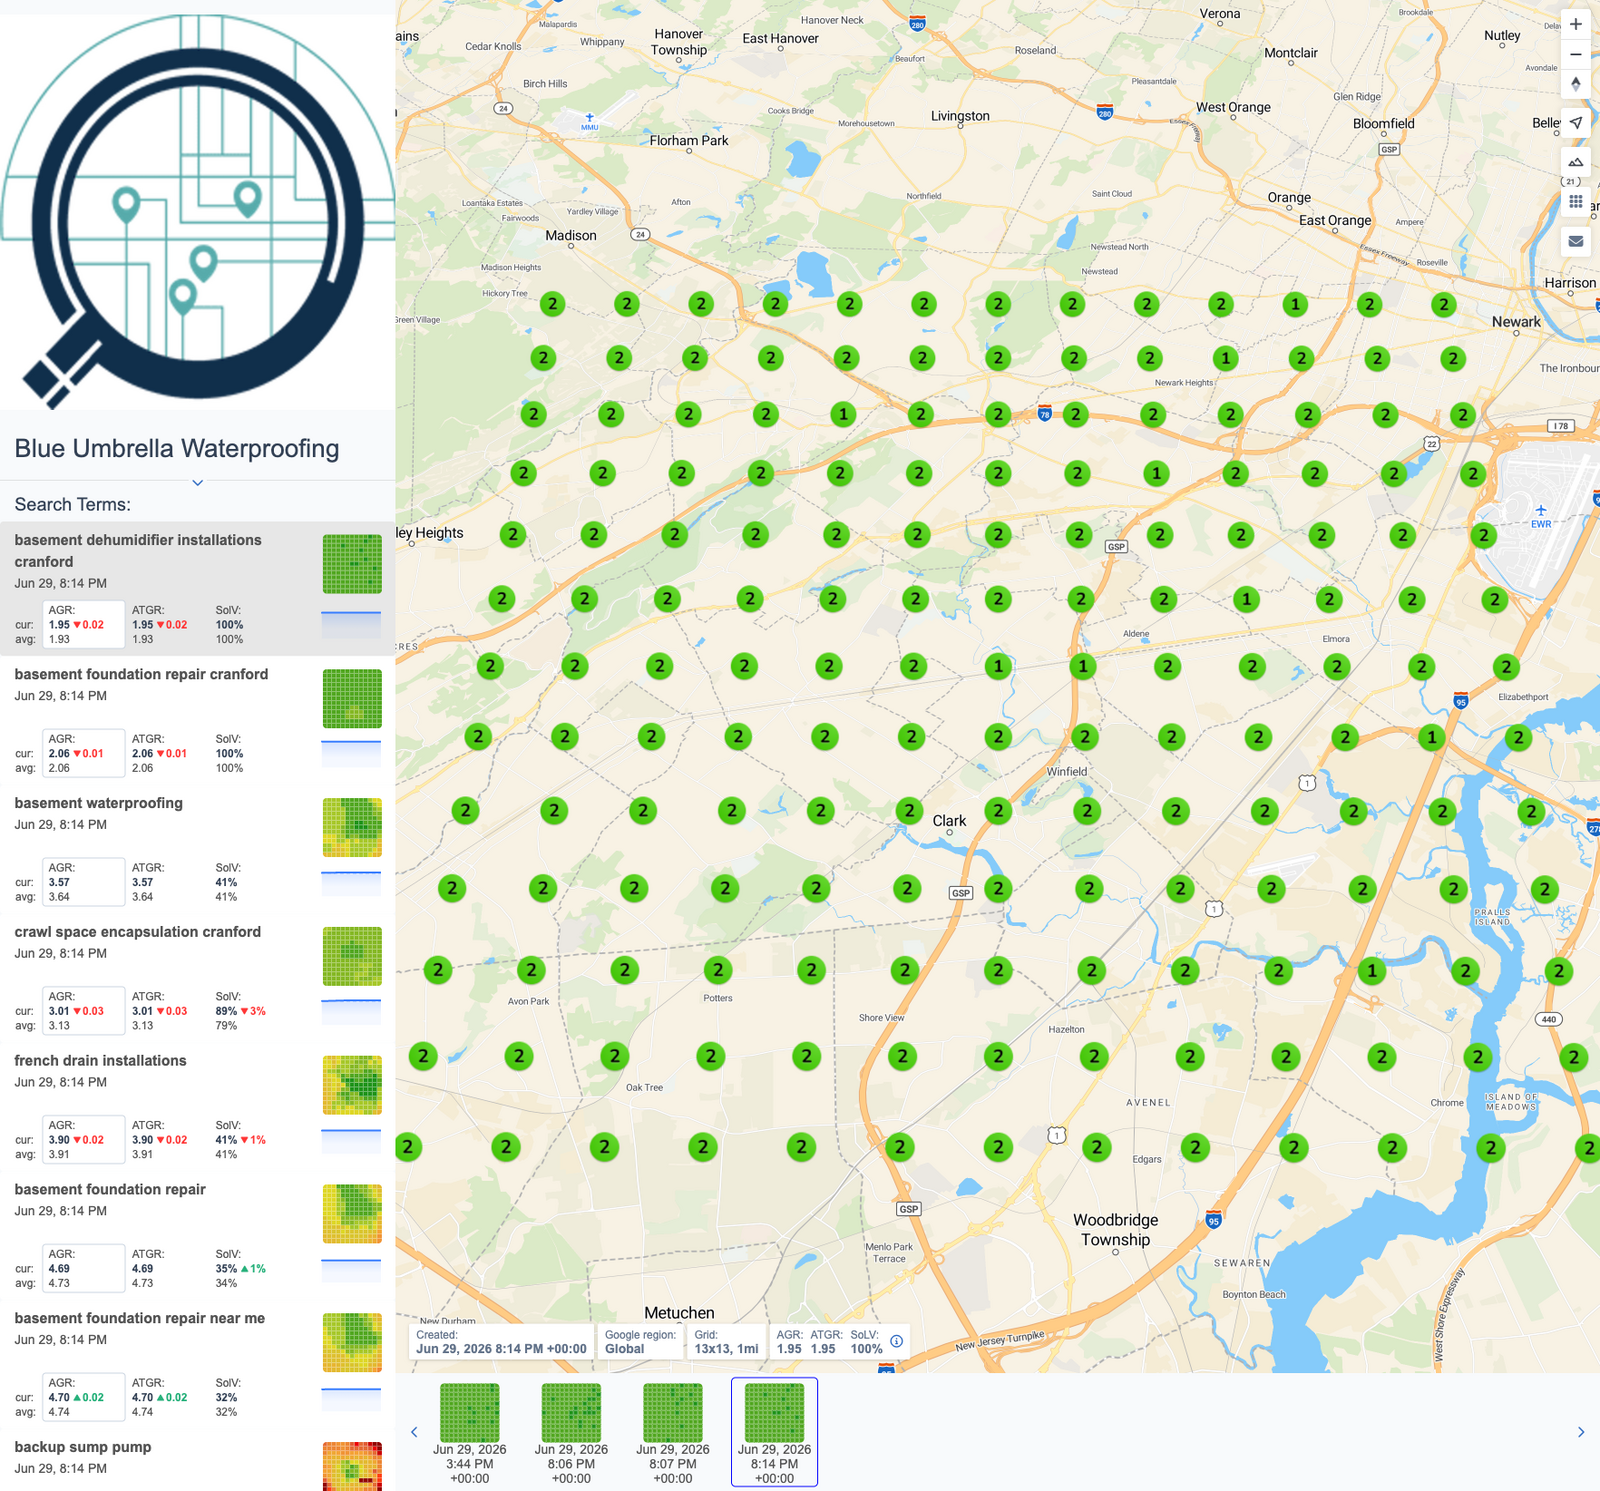
The globe icon in the header opens the config's public report - a live, login-free page with your branding, every search term's current and average scores, the full map and the complete run history. Send the URL to a client and they always see the latest data. Per-search-term public links (the link icon next to it) work the same way but scope the page to one search term, optionally limited to a date range:
3D mode on the public map
The public map has its own controls along the edge: zoom, compass (drag to rotate), locate, a terrain toggle, and overlays for search zones and zip-code zones. Enabling terrain and tilting the view (hold Shift and drag, or use the compass) turns the report into a 3D perspective - a nice touch when presenting a large grid on a call:
The GIF export
The GIF button renders the entire run history for a search term as an animated map (looping or play-once) and gives you a download link when it's ready. It's the most persuasive before/after artifact you can put in an email or a slide - here's a real one: