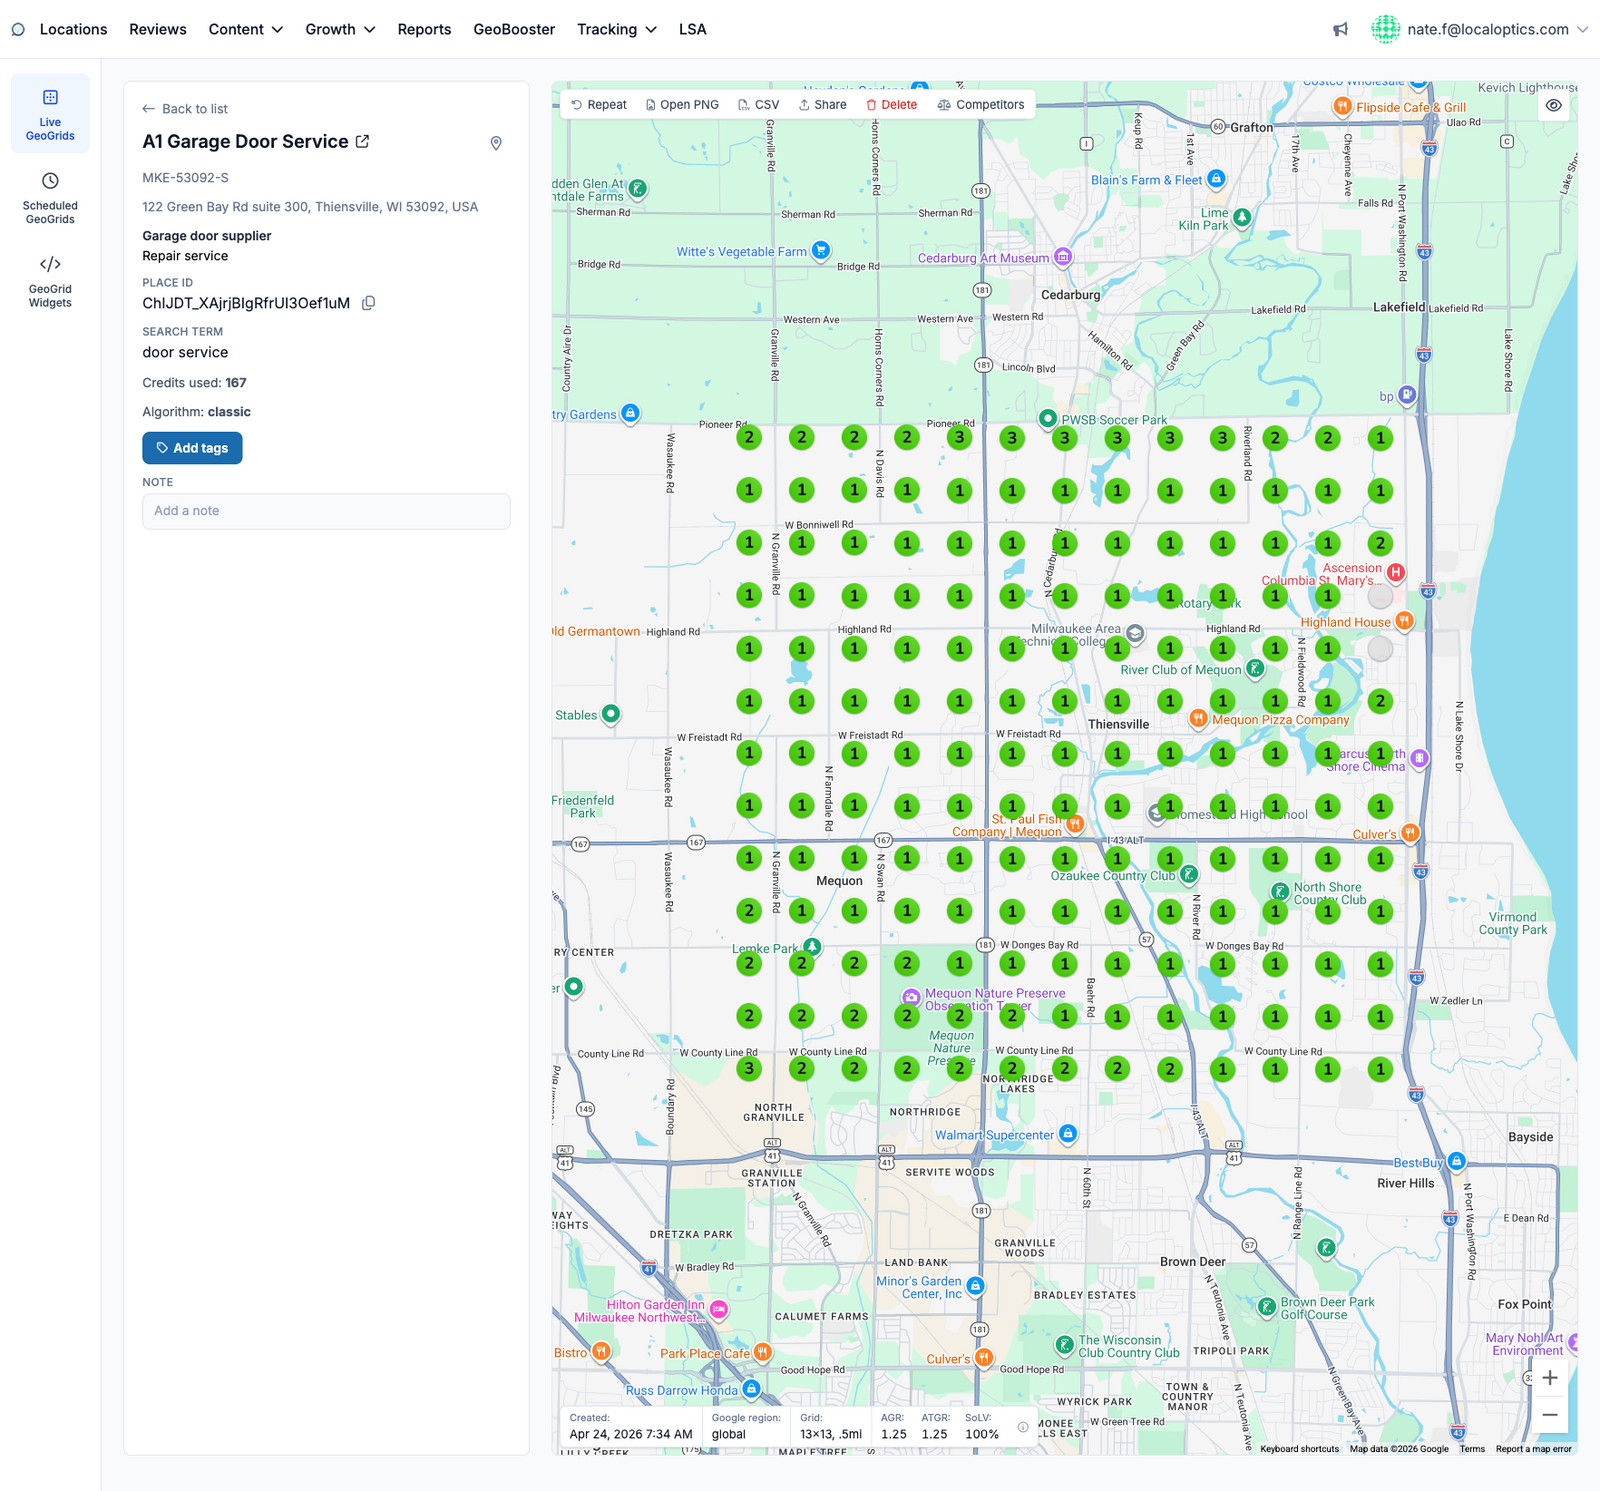
Your Google ranking is not one number - it changes block by block across your service area. A geogrid makes that visible: LocalOptics lays a grid of points over the map around your business and runs the same Google search from every point, showing exactly where you win, where you fade, and where competitors own the neighborhood.
Reading the map
Each marker on the grid is your rank in that spot's local search results:
Green (1-3) - you're in the map pack at that point.
Yellow to orange (4-15) - visible but losing clicks to the businesses above you.
Red (16-20) - barely present.
X - not found in the top 20 at that point.
0 - Google returned no results there; D - a point you disabled; ! - the check failed and is not charged.
The three scores
Every geogrid is summarized by three numbers, shown on the map and in every list:
AGR (Average Grid Rank) - your average rank counting only the points where you appear in the top 20. "How well do I rank where I actually show up?"
ATGR (Average Total Grid Rank) - the average across all points, with off-grid points counted as 21. This is the honest number - it punishes holes in your coverage, so it's the best score to track over time.
SoLV (Share of Local Voice) - the percentage of grid points where you rank in the top 3 (the map pack). This is the closest thing to "how much of the map do I own?"
What a scan costs
Each grid point consumes one geogrid credit per scan, so cost equals grid size: a 3x3 grid uses 9 credits, 7x7 uses 49, and a full 13x13 uses 169. Credits come from your organization's geogrid wallet, and disabled points aren't charged.
A live geogrid for our example business - a 13x13 grid at half-mile spacing, ranking 1-2 across the entire area (ATGR 1.25, SoLV 100%):